A graph shows every output of a function at once, which makes it the fastest place to see where the outputs are heading. To read from a graph, put your finger on the curve a little to the left of and slide it toward , watching its height; then do the same from the right; then compare. What sits exactly at never enters into it (topic 1.2).
One-sided limits
Sliding in from one side at a time gives the two one-sided limits:
- the left-hand limit is the height the graph approaches as comes toward through values less than ;
- the right-hand limit is the height it approaches through values greater than .
A parking garage that charges $5 for up to one hour and $8 for more than one hour has a cost graph that jumps at . Just before one hour the cost is $5, and just after it is $8, so
The two sides disagree. No single number is approached by the cost for all times near 1 hour, so does not exist, even though is perfectly well defined.
This is why a two-sided limit needs a check on each side. The definition in topic 1.2 asks the outputs to be close to for every near , and "every near " includes inputs on both sides.
Three ways a limit fails to exist
A limit exists only if the outputs settle on one real number. They can fail in three ways, and each has its own look on a graph.
The sides disagree (a jump). The function equals for every and for every , because dividing a number's size by the number leaves only its sign. Its graph is two horizontal half-lines with a break at 0. The left-hand limit at 0 is , the right-hand limit is 1, and the two-sided limit does not exist.
The outputs are unbounded (a vertical asymptote). As approaches 0, is a tiny positive number, so is a huge positive number: at it is , at it is . The graph shoots up on both sides of the line . You write
which describes how the limit fails: the outputs grow past every bound, so they approach no real number and the limit does not exist. Compare . For just right of 0 it is huge and positive, for just left of 0 it is huge and negative:
The sides head in opposite directions, so not even the shorthand describes the two-sided behavior. All you can say is that does not exist.
The outputs oscillate. As approaches 0, races off toward , so runs through complete sine waves faster and faster. It equals 1 at and at , and both lists of inputs crowd in on 0. However close to 0 you stay, the outputs keep swinging between and 1, so they can't be held near any one number. The limit does not exist, and on a screen the graph near 0 looks like a solid smear.
When the picture misleads
A graphing calculator does not draw a curve. It computes the function at a limited number of inputs across the window, roughly one per column of pixels, and joins the dots. Anything that happens between those inputs is invisible. Here is
drawn two ways.
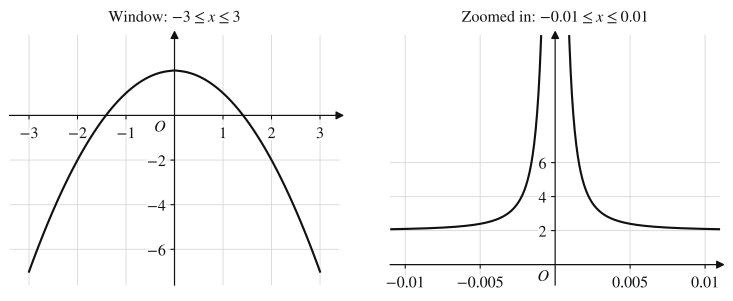
The left window joins the values at 96 evenly spaced inputs from to 3. The ones nearest 0 are , where the last term of is only about , so the plotted curve peaks at about 2 and suggests . Zoomed in, the truth appears: at the last term is already 10, and as it grows without bound, so . A hole is even easier to miss, since a single missing point is far narrower than a pixel: the function of topic 1.2 looks like an unbroken line on a calculator screen unless one of the plotted inputs happens to land exactly on .
So a graph gives an estimate. When a limit matters, zoom in near on both sides, check a table of values close to (topic 1.4), or settle it with algebra (topics 1.5 and 1.6). A graph printed in an exam question is a different case: it marks holes with open circles, function values with filled dots, and asymptotes with dashed lines, and you read limits from those marked features and labeled points. Some exam figures are labeled as not drawn to scale, so take heights from the labels and grid, not by measuring the curve.
Worked examples
Let . Find , and , if they exist.
Show solution
The fraction is the sign of , so split at , where the sign changes.
For , , the fraction is 1, and . For , , the fraction is , and . The graph is the line up to an open circle at , then the line starting from an open circle at , and is undefined.
The one-sided limits are different numbers, so does not exist. Using each side's own formula is the move here because a one-sided limit only ever looks at one side's inputs.
Let and . Describe the behavior of each near with limit notation.
Show solution
Both have a vertical asymptote at , since their denominators approach 0 while the numerator stays 3. What differs is the sign of the denominator on each side.
For : when is slightly less than 2, is a tiny negative number, so is a large negative number; when is slightly more than 2, is large and positive. So
and does not exist (it is not , because the left side goes the other way).
For : squaring makes a tiny positive number on both sides, so is large and positive on both sides:
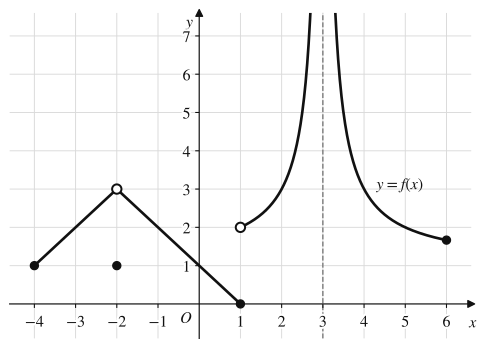
The graph of the function , defined for except at , is shown below. The line is a vertical asymptote.
(a) Find and .
(b) Find , and , if they exist.
(c) Describe the behavior of as approaches 3.
(d) For which values of with does fail to exist?
Show solution
(a) From the left, the segment rises toward height 3; from the right, the segment falls back from height 3. Both one-sided limits are 3, so . The filled dot gives . The limit and the value differ, which is allowed: the limit only looks at .
(b) From the left, the falling segment reaches height 0, so . From the right, the curve starts at the open circle at height 2, so . Since , does not exist. That matches the left side changes nothing.
(c) The graph rises without bound on both sides of the asymptote, so and , which together give . The outputs approach no real number, so the limit does not exist as a number.
(d) (the one-sided limits differ) and (the outputs are unbounded). At the limit exists despite the odd dot, and at every other in the interval the graph is an unbroken curve through , so the limit is just the height there.
Where students lose points
Check yourself
Question 1
Let for , for , and . What is ?
- A
- B
- C
- D
The limit does not exist.
Show answer
B
From the left, approaches 3; from the right, approaches 3. Both one-sided limits are 3, so the limit is 3. Choice A is , which the limit ignores; the graph has a hole at and a dot at .
- A
Question 2
Each of these limits fails to exist. For each, say which way it fails: the one-sided limits disagree, the outputs are unbounded, or the outputs oscillate. (a) (b) (c)
Show answer
(a) The outputs oscillate. (b) The outputs are unbounded. (c) The one-sided limits disagree.
(a) at and at , and both lists crowd in on 0. (b) The numerator approaches 2 while the denominator is a tiny positive number on both sides, so the outputs grow without bound (the limit is ). (c) For the expression is , and for it is , so the left-hand limit is 0 and the right-hand limit is 2.
Question 3
Let . Which statement about is true?
- A
It does not exist, because is unbounded near .
- B
It does not exist, because oscillates near .
- C
It does not exist, because the left-hand and right-hand limits are different.
- D
It equals 2.
Show answer
C
The numerator is . For , , which approaches 2; for , , which approaches . The one-sided limits are 2 and , so the limit does not exist. Choice D is only the right-hand limit, and choice A mistakes the zero denominator for an asymptote: the numerator is also 0 at , and the factor cancels.
- A
Question 4
In the window on a graphing calculator, the graph of a function looks like an unbroken curve passing through the point . What does this tell you about ?
Show answer
Only that 4 is a reasonable estimate. The screen joins a limited set of plotted points, so it can hide a hole, a spike or an oscillation near 0; the limit has to be confirmed by zooming in, a table, or algebra.
A function like looks just like this in a wide window, yet its limit at 0 is . A graph supports an estimate, not a conclusion, when the scale is coarse.