A high school with 1,800 students wants to know how many hours a week its students spend on homework, and it can afford to survey 90 of them. Which 90? If a person picks them, the choice drifts toward students who are easy to find, friendly, or sitting nearby, and those students may not do typical amounts of homework. Letting chance do the choosing removes that drift, and there are several ways to put chance to work. Each is a random sampling method, and each has studies it fits and studies it doesn't.
With or without replacement
Every method below is built from draws, and a draw can work two ways.
- Sampling without replacement: once an individual is picked, they are out of the pool. Nobody can be selected twice. This is how real surveys work, since interviewing the same person twice adds nothing.
- Sampling with replacement: after each pick, the individual goes back into the pool, so the same individual can be selected again.
The difference matters most when the population is small. Draw 3 names, with replacement, from a hat of 10. The chance that all three draws are different people is , so there is a 0.28 chance that someone is picked twice. Do the same with 10,000 names and the chance of a repeat is about 0.0003. In a large population the two kinds of sampling behave almost identically, which is why the inference topics in Units 3 and 4 let you treat a sample drawn without replacement as if the draws were independent, provided the 10% condition holds: the sample size is at most 10% of the population size (). The hat of 10 fails it (3 draws is 30% of the names), and that is exactly where the repeat chance of 0.28 showed up; 3 draws from 10,000 is 0.03%.
Simple random sample
A simple random sample (SRS) of size is chosen so that every possible group of individuals from the population has the same chance of being the sample. It is the basic random method; the others below use an SRS as one of their steps.
The definition is about groups, not individuals, and the difference has teeth. Suppose a teacher with 20 students flips a coin: heads, she surveys the first 10 names on her roster; tails, the last 10. Each student has a chance of being chosen, yet only 2 of the 184,756 possible groups of 10 can ever occur. Two students from the top of the roster can be in the sample together, but a student from the top and one from the bottom never can. That is not an SRS.
Two standard ways to get one:
- Random number generator. Label the individuals to . Have a calculator or computer produce random integers from to , skip any label that repeats, and continue until you have different labels. The individuals with those labels form the sample.
- Slips of paper. Write each individual's name on an identical slip, put the slips in a container, mix thoroughly, and draw slips without replacement.
For the school, label the 1,800 students to from the enrollment list and generate random integers from 1 to 1,800, ignoring repeats, until there are 90 different labels. Every one of the roughly possible groups of 90 is equally likely.
Stratified random sample
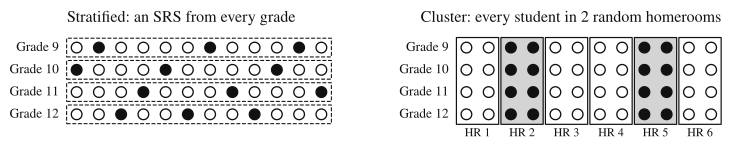
A stratified random sample first splits the whole population into groups called strata (singular: stratum). Every individual belongs to exactly one stratum, and the strata are formed so that individuals inside each one are alike on some characteristic, such as grade level. Then you take a separate SRS from every stratum and put those together as the sample.
At the school, the strata could be the four grades: 500 ninth graders, 460 tenth graders, 440 eleventh graders and 400 twelfth graders. Ninety students is 5% of 1,800, so taking 5% of each grade gives SRSs of 25, 23, 22 and 20 students. Sampling the same fraction from each stratum is called proportional allocation; it is common but not required, and a study that needs a reliable estimate for a small group may sample that group more heavily.
Stratifying pays off when the response differs from stratum to stratum. Seniors in this school might average many more homework hours than ninth graders. An SRS of 90 could, by bad luck, contain only 12 seniors instead of their fair share of 20, and the estimate of the school's average would come out too low. A stratified sample guarantees each grade its share. Because the chance variation in how many of each grade land in the sample is removed, estimates from a stratified sample vary less from sample to sample than estimates from an SRS of the same size. Stratifying also gives you a separate SRS for each grade, so you can estimate each grade's average too.
Cluster random sample
A cluster random sample also splits the population into groups, called clusters, but uses them in the opposite way. You take an SRS of clusters and then collect data from every individual in the chosen clusters.
At the school, the 1,800 students sit in 60 homerooms of 30. Choose 3 homerooms at random and survey all 90 students in them. The appeal is practical: you need a list of homerooms, not a list of students, and you visit 3 rooms instead of tracking down 90 individuals across the building. For a national survey, picking a few city blocks and knocking on every door is far cheaper than traveling to 1,000 scattered addresses.
Clusters work well when each one looks like a small copy of the population: mixed inside, and similar to one another. Homerooms that mix all four grades fit that description. If the school assigned homerooms by grade, a cluster sample could easily land on three senior homerooms and badly misjudge homework time for the school.
Systematic random sample
A systematic random sample picks a random starting point and then takes every th individual from an ordered list or stream. To take 90 from a list of 1,800, use , pick a random integer from 1 to 20 as the start, say 7, and take positions 7, 27, 47, and so on up to .
This method needs no complete list in advance, so it suits a stream of individuals: every 20th customer through a door, every 50th part off an assembly line. Each individual has a chance of selection, but there are only 20 possible samples (one per starting point), so it is not an SRS. The random start is what makes it random; without one, the person running the study picks the sample.
The danger is a list with a repeating pattern that lines up with . A machine that makes bottle caps in a mold with 10 cavities produces caps from the cavities in rotation. Sampling every 10th cap measures caps from one cavity over and over, and a defect in any other cavity never shows up.
Choosing a method
No method is best everywhere. The question being investigated, and what you know about the population, decide.
| Method | Fits when | Watch out for |
|---|---|---|
| SRS | You have a full list and no reason to split the population | Can, by chance, underrepresent a group |
| Stratified | A known characteristic is related to the response, or you need estimates for each group | Needs every individual's stratum in advance |
| Cluster | Individuals come in natural groups and reaching a few whole groups is cheap | Poor if clusters differ from one another |
| Systematic | Individuals arrive in order, or the list is long and you want a quick procedure | Periodic patterns in the list |
Worked examples
Identify the sampling method in each study.
- A regional hospital network has 14 clinics. It randomly selects 3 clinics and gives a satisfaction survey to every patient seen at those 3 clinics during one week.
- An airline divides last month's passengers into first class, business and economy, and selects an SRS of 40 passengers from each group.
- A national park ranger picks a random integer from 1 to 25, stops that car at the entrance gate, and then stops every 25th car after it.
- A school district randomly selects 4 of its 12 schools and then selects an SRS of 30 students from each of those schools.
Show solution
Look for two things: whether the population is split into groups, and whether the sample takes some individuals from every group or all individuals from some groups.
- Cluster. The clinics are the groups, a random set of them is chosen, and everyone in each chosen clinic is surveyed.
- Stratified. The cabin classes are the groups, and an SRS comes from every one of them. Passengers within a class are alike in what they paid and how they flew, which is what strata should be.
- Systematic. A random start followed by a fixed interval of 25.
- Neither cluster nor stratified. Schools are chosen at random, as in a cluster sample, but then only some students in each chosen school are surveyed, so it is not a cluster sample, which takes everyone. It is not stratified either, because 8 of the schools contribute no one. It is a two-stage random sample (statisticians call it multistage).
A grocery store's loyalty program has 6,000 members, listed alphabetically by last name. The manager wants to survey 120 of them.
(a) Describe how to select an SRS of 120 members.
(b) Describe how to select a systematic random sample of 120 members.
(c) A clerk suggests choosing a random letter of the alphabet and surveying the first 120 members whose last names start with that letter. Would this produce an SRS? Explain.
Show solution
(a) Label the members to in the order of the list. Use a random number generator to produce integers from 1 to 6,000, ignoring any repeated label, until there are 120 different labels. Survey the members with those labels. Each piece (labels, mechanism, repeats) is there because a grader checks for it.
(b) The interval is . Use a random number generator to pick an integer from 1 to 50 as the starting position, survey that member, and then survey every 50th member after it on the list.
(c) No. A sample that includes one member named Garcia and one named Nguyen can never occur, since every chosen member's last name starts with the same letter, so not every group of 120 is equally likely. It is also not even fair to individuals: a member whose name starts with a letter shared by thousands of others is far less likely to be among "the first 120" than a member whose letter is rare.
A county transportation office wants to estimate the mean one-way commute time of the county's 64,000 workers. Of them, 40,000 live in the county's one city and 24,000 live in its rural townships. Commutes from the townships are known to be much longer on average. The office can survey 400 workers and has a list of all workers and their home addresses.
(a) Describe a stratified random sample of 400 workers that the office could use.
(b) Explain why the stratified sample in part (a) would give a better estimate of the county's mean commute time than an SRS of 400 workers.
(c) An official suggests numbering the county's 16 neighborhoods and townships, randomly selecting 2, and surveying every worker who lives in them. Explain a statistical problem with this plan.
Show solution
(a) Use place of residence as the strata: city and rural. City residents are of the workers, so take an SRS of city workers and an SRS of rural workers, each by labeling the workers in that stratum and using a random number generator, ignoring repeats. Combine the 400 workers into one sample.
(b) Commute time depends strongly on where a worker lives. An SRS of 400 might, by chance, include noticeably more or fewer rural workers than their 37.5% share, and since rural commutes are longer, the sample mean would swing high or low with that count. The stratified sample fixes the mix of city and rural workers at the population's mix, removing that source of variation, so its sample mean varies less from sample to sample and is more likely to be close to the county's true mean commute time.
(c) This is a cluster sample whose clusters are geographic, and commute time depends on geography. The clusters do not look like the county as a whole: township residents have much longer commutes on average than city residents. If both selected areas are townships, the sample mean is likely to be well above the county mean; if both are city neighborhoods, well below. Clusters are a good choice only when each one mirrors the population, and here they differ from one another on exactly the variable being measured.
Where students lose points
On the exam
Multiple-choice questions describe a study and ask which method it used or which method fits. Free-response Question 1 is a multi-part question built mainly on Practice 1 (formulate questions) and Practice 2 (collect data), so a part of it may ask you to describe how to select a sample or explain why one method beats another. An explanation earns credit only when it names the variable that makes the method work or fail ("commute time depends on where a worker lives") in the context of the study. No calculator work is involved beyond simple proportions.
Check yourself
Question 1
An apple orchard has 40 rows of trees. To estimate the mean yield per tree, the manager randomly selects 5 of the rows and weighs the apples from every tree in those 5 rows. Which sampling method is this?
- A
Simple random sample
- B
Stratified random sample
- C
Cluster random sample
- D
Systematic random sample
Show answer
C
The rows are groups, a random set of rows is chosen, and every tree in a chosen row is measured: that is a cluster sample. Stratified is the tempting wrong answer, but a stratified sample would take some trees from every one of the 40 rows.
- A
Question 2
A magazine has 2,400 subscribers on an ordered list and wants a systematic random sample of 80. What interval should it use, from what range should the starting position be chosen, and if the random start is 12, which list positions are the first three subscribers in the sample?
Show answer
The interval is 30, the start is a random integer from 1 to 30, and with a start of 12 the first three positions are 12, 42 and 72.
. The start must be random among the first positions so every subscriber has a chance; after that, each selection is 30 positions past the last.
Question 3
A university expects on-campus and commuter students to rate its parking very differently and wants a separate estimate for each group. Which sampling plan fits best?
- A
An SRS of all students
- B
A stratified random sample with residence (on-campus or commuter) as the strata
- C
A cluster sample of randomly chosen dorm floors, surveying everyone on each floor
- D
A systematic sample from an alphabetical list of all students
Show answer
B
Stratifying by residence guarantees enough students of each kind for two estimates and separates a variable known to be related to the response. The dorm-floor cluster plan reaches no commuters at all, so it cannot estimate their rating.
- A
Question 4
A club with 40 members will interview 25 of them. Why would drawing names with replacement be a poor way to choose the 25?
Show answer
With replacement, the probability that some member is drawn more than once is greater than 0.9999, so the club would almost surely end up with fewer than 25 different people.
The chance all 25 draws are different is , which is about 0.00006. Because the sample is a large share of a small population, repeats are nearly certain; sampling without replacement avoids them.