In 1936 the magazine Literary Digest polled about 10 million Americans on the presidential race, got back about 2.4 million ballots, and predicted that Republican Alf Landon would beat Franklin Roosevelt with about 57% of the vote. Roosevelt won about 61% of the popular vote and 46 of the 48 states. The poll was huge and still wrong by a landslide, while George Gallup, with a sample of about 50,000, called the winner correctly. Size could not save the Digest, because its error came from how the sample was gathered, and no amount of extra data fixes that.
Bias is a property of the method
A statistic (a number computed from a sample, like a sample proportion) estimates a parameter (the same number for the whole population). Two different things can make a statistic miss.
Sampling variability is the ordinary chance difference between one random sample and the next. It goes both ways, high on some samples and low on others, and it shrinks as the sample gets larger.
Bias is a systematic error built into the sampling method: repeated over and over, the method produces statistics that are consistently too large, or consistently too small, compared with the parameter. A biased method misses in the same direction every time, and a larger sample does nothing about it.
A concrete case: in a town, 30% of adults are under 35. Of them, 70% stream music daily; of the older 70%, only 30% do. The true proportion who stream daily is
A pollster draws random numbers from the town's landline listings, where people under 35 make up only 10% of the names. Samples from that list center on
eight points too low. Drawing 2,000 people from the list instead of 200 just pins the estimate more tightly around the wrong value, 0.34.
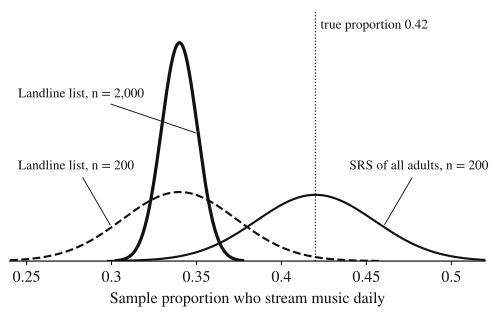
Bias describes the method, not one sample. A single SRS might, by bad luck, contain too many seniors; that is sampling variability, and the next SRS might contain too few. A method is biased when its errors lean one way across the samples it would produce.
Bias from who ends up in the sample
Nonrandom sampling methods let people, not chance, decide who is in the sample, and that opens the door to bias. Two are common.
A convenience sample takes whoever is easiest to reach: the students in the cafeteria at noon, shoppers at one mall entrance, the researcher's own classmates. The individuals who are easy to reach often differ from the rest of the population in ways related to the question.
A voluntary response sample is made up entirely of people who chose to respond to an open invitation: a call-in radio poll, an online star rating, a link posted on social media. The resulting voluntary response bias comes from who bothers. People with strong opinions, usually negative ones, respond far more often than people who feel mildly. A restaurant's online reviews pile up at one star and five stars because diners who had an ordinary meal rarely write anything.
Even with random selection, the sampling method itself can miss people.
Undercoverage occurs when some part of the population cannot be selected by the method, or is less likely to be selected than others. The landline list above undercovers young adults. A survey of a city's residents drawn from property tax records misses renters, since the records list owners. A survey given during one class period misses every student who is not in school at that time. Undercoverage creates bias when the missed group answers differently from everyone else; the Digest's 1936 mailing list came largely from its own subscribers, telephone directories and automobile registrations, all of which skewed toward wealthier voters during the Depression.
Nonresponse occurs when individuals who were chosen for the sample can't be reached or decline to answer. Nonresponse creates bias when the people who respond differ from those who don't in ways that matter for the question. A survey on how many hours people work each week will hear least from the people working the most hours, because they have the least time to answer. Only about 24% of the Digest's 10 million ballots came back, and a 1988 analysis by political scientist Peverill Squire concluded that nonresponse was the bigger of its two problems: voters who disliked Roosevelt were more eager to mail in a ballot.
The difference between nonresponse and voluntary response is who chose. In voluntary response, the respondents selected themselves. In nonresponse, the researcher selected the sample and some of those people did not answer.
Bias from how responses are measured
Response bias occurs when the answers or measurements recorded tend to differ from the true values in one direction. The sample can be perfectly chosen and still produce biased data. Common sources:
- Question wording. Leading or confusing questions push answers. "Given the rising number of pedestrian injuries, do you support lower speed limits downtown?" steers respondents toward yes before they have considered the cost. A double negative ("Do you oppose not renewing the library levy?") confuses people into answering the opposite of what they mean.
- Self-reported answers. People shade their answers toward what sounds good or what they wish were true: they report more exercise, more voting and fewer drinks than they had. The bias grows when the question is sensitive and the setting is not private, such as a face-to-face interview.
- The interviewer or the instrument. Respondents may tell an interviewer what they think the interviewer wants to hear. A bathroom scale that reads 0.4 kg heavy makes every measured weight 0.4 kg too high, so the mean of 50 measured weights is also 0.4 kg too high, and the mean of 5,000 would be too.
Worked examples
Identify the most likely source of bias in each survey.
- A sports radio host asks listeners to call in and say whether the city should spend public money on a new stadium.
- A city selects a random sample of 400 addresses from its property tax records to survey residents about rent control.
- A nonprofit mails a survey about working conditions to a random sample of 500 restaurant employees; 140 return it.
- A doctor asks each patient at a checkup, face to face, how many alcoholic drinks they have in a typical week.
Show solution
For each, decide whether the problem is in who could be or chose to be in the sample, or in the answers themselves.
- Voluntary response bias. Listeners decide whether to call. Those who feel strongly, and sports radio listeners in general, are far more likely to call than the average resident, so the share in favor of the stadium is likely overstated.
- Undercoverage. Property tax records list owners, so renters, the people most affected by rent control and the most likely to support it, are left out. The estimated support would likely be too low.
- Nonresponse. The sample was chosen at random, but only responded. Employees with the worst conditions may be too overworked to reply, or may be the angriest and most eager to; either way, respondents can differ from nonrespondents on the very thing being measured.
- Response bias. Drinking is sensitive, and the question is asked face to face by a doctor, so patients are likely to underreport. The mean reported number of drinks would be too low.
A city surveyed a random sample of 800 households about a new fee for the public pool. Half the households, chosen at random, were asked: "Do you support a $15 annual fee so the pool can stay open to families all summer?" The other half were asked: "Do you support adding a new $15 annual fee to every household's water bill?" In the first group 248 households said yes; in the second, 152 did. Explain what the results show.
Show solution
The proportions saying yes were and . Both groups were random halves of one random sample, so the households in them are similar; the large gap comes from the wording. The first version names a benefit ("families all summer"); the second emphasizes a cost added to every bill. Neither version measures "true" support well, and a report that quotes only one of them would give a biased estimate, too high with the first wording and too low with the second. A neutral question states the proposal and its cost without arguing for or against it: "Do you support or oppose a $15 annual fee to fund the public pool?"
Notice the design: assigning the two wordings at random is an experiment, which Topic 1.13 develops.
A city council wants to estimate the proportion of adult residents who support building a fenced dog park.
(a) The parks department posted a link to an online survey on its social media page. Of the 412 people who responded, 78% said they support the dog park. Identify a source of bias in this method, and explain how it would likely affect the estimate.
(b) The council then mailed a survey to a random sample of 600 addresses selected from a list of all residential addresses in the city. Of the 210 surveys returned, 61% supported the dog park. Explain how this method could still produce a biased estimate.
(c) A council member suggests mailing the survey to 3,000 random addresses instead of 600. Will this fix the problem in part (b)? Explain, and suggest a better improvement.
Show solution
(a) This is a voluntary response sample: the respondents chose to take the survey. Residents who care strongly about a dog park, most of them dog owners who want one, are more likely to see a parks department post and to click through than residents who don't care. Since those motivated residents favor the park, 78% likely overestimates the proportion of all adult residents who support it. (Undercoverage is a valid second answer: residents who don't follow the parks department online had no chance to respond.)
(b) Only of the selected households responded, so this is nonresponse. If the households that returned the survey differ from those that didn't, the estimate is biased. For example, dog owners have a personal stake and may be more likely to return it; if so, the 61% overstates support among all adult residents. A response that names the group, says how its views differ, and gives the direction earns the credit.
(c) No. Mailing to 3,000 addresses would make the estimate less variable, but if the same kinds of residents ignore the survey, about 65% of the larger sample would still go unheard and the bias would remain. The better fix is to raise the response rate within the 600: send reminders, follow up by phone or in person with nonrespondents, or offer a short online option. Getting answers from the people originally chosen is what removes nonresponse bias.
Where students lose points
On the exam
Multiple-choice questions describe a survey and ask which bias is most likely, or which change would reduce it. In free response, part of the first question (which focuses on formulating questions and collecting data) can ask for a source of bias and its likely effect; the explanation must mention the context of the study and, when asked, a direction. Random selection removes the bias that comes from a person choosing the sample, but it does nothing about undercoverage in the list, nonresponse, or response bias, so each needs its own check.
Check yourself
Question 1
A researcher selects an SRS of 300 students from a school's roster. A teacher then asks each selected student, aloud in front of the class, whether they have ever cheated on a test. Which source of bias is most likely?
- A
Voluntary response bias
- B
Undercoverage
- C
Nonresponse bias
- D
Response bias
Show answer
D
The students were chosen at random and all of them answer, so the problem is in the answers: a sensitive question asked publicly leads students to deny cheating, so the proportion would be too low. Nonresponse is tempting, but no selected student failed to respond.
- A
Question 2
A website polls its visitors with a pop-up question, and 2,000 visitors answer. Its owner wants a better estimate of the opinion of all adults and plans to keep the poll open until 20,000 visitors have answered. What will the larger sample do?
- A
Remove the bias, because large samples are representative
- B
Make the estimate vary less from poll to poll, but leave the bias
- C
Increase the bias, because more volunteers respond
- D
Turn the voluntary response sample into a random sample
Show answer
B
More responses reduce sampling variability, but the respondents are still self-selected website visitors, so the estimate stays centered on the wrong value. Choice A is the mistake that sank the 1936 Literary Digest poll.
- A
Question 3
A random sample of 400 town residents is asked whether they volunteered in the past year. Only 200 respond, and 30% of them say yes. Suppose that, in fact, only 10% of the nonrespondents volunteered. What proportion of all 400 selected residents volunteered, and in which direction does the survey's 30% miss?
Show answer
0.20 of the 400 volunteered, so the survey's 30% overestimates the proportion.
Among respondents, volunteered; among nonrespondents, . That is . People who volunteer are more willing to answer a survey about volunteering, so the respondents overrepresent them.
Question 4
A pollster dials randomly generated cell phone numbers. Name the source of bias created by (i) adults who do not own a cell phone and (ii) adults who see an unknown number and never pick up.
Show answer
(i) Undercoverage. (ii) Nonresponse.
Adults without a cell phone cannot be selected by this method at all, which is undercoverage. Adults who ignore the call were selected but gave no answer, which is nonresponse.