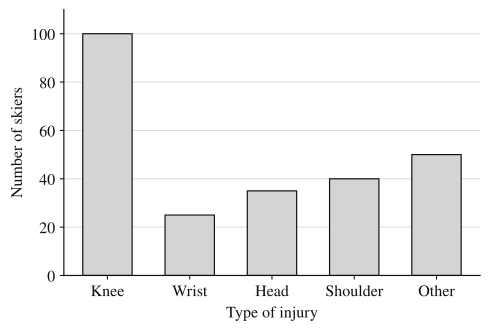
A ski resort's clinic recorded the type of injury for each of the 250 skiers it treated last season: 100 knee injuries, 25 wrist, 35 head, 40 shoulder and 50 other. Topic 1.3 put counts like these in a table. A graph shows the same information at a glance, so that the biggest category, and how much bigger it is, jump out before anyone reads a number. Two graphs do this for a categorical variable: the bar chart and the pie chart.
Bar charts
A bar chart (or bar graph) has one bar for each category. The bar's height (or its length, if the bars run sideways) is the category's frequency or relative frequency.
To build one:
- Put the categories along one axis and label it with the variable's name.
- Put a numerical scale on the other axis, starting at 0, labeled "Frequency" (or what was counted) or "Relative frequency."
- Draw one bar per category, all the same width, with equal gaps between them, each reaching its category's value.
The gaps matter. They show that the categories are separate groups, not intervals on a number line, which is what a histogram's touching bars mean (topic 1.5). The order of the bars is a choice: for categories with no natural order, sorting from tallest to shortest makes comparisons easy; for ordered categories (Never, Sometimes, Often), keep their order.
A frequency bar chart and a relative frequency bar chart of the same data have exactly the same shape. Dividing every count by 250 rescales the axis and leaves every bar's height relative to the others unchanged. The difference only matters when two groups are compared, below.
Pie charts
A pie chart shows a whole divided into parts. Each category gets a slice, and the slice's share of the circle equals the category's relative frequency. Since the angles around the center add to , a category with relative frequency gets a slice with angle . The knee slice is ; the wrist slice is .
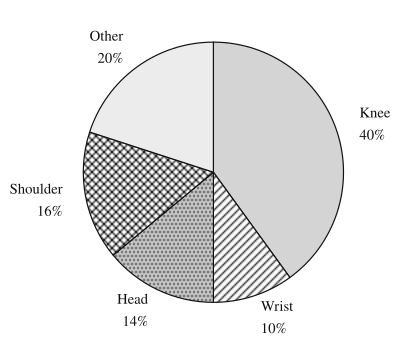
Because the slices fill the circle, they add to 1 (100%) of it, and that's the condition for using one: each unit must fall in exactly one category, and the categories must cover everyone. Two situations break it:
- Units in more than one category. A survey asking "Which streaming services do you use? Check all that apply" lets one person count for several services, so the percentages add to more than 100%. There is no whole for the slices to divide. Use a bar chart, with each bar showing the percentage of respondents who use that service.
- A missing category. If a report gives percentages for Knee, Wrist and Head only (64% together), a pie with only those three slices would make each look bigger than it is. Add the remaining category ("Other," 36%) or use a bar chart.
Pie charts are good at one comparison: a part against the whole ("knee injuries were 40% of the total, a bit less than half"). Bar charts are better for comparing categories with each other, because the eye judges heights from a common baseline more accurately than angles. In the pie above, the Head (14%) and Shoulder (16%) slices are hard to rank by eye; in the bar chart it's obvious.
Using a graph to back a claim
A claim about a categorical variable is supported by a graph when you can read off the specific values that make it true and say them in context. "Knee injuries were the most common type among the clinic's injured skiers: 100 of 250, or 40%" uses the graph. "The knee bar is biggest" describes the picture without saying what it means.
Read the scale before you read the bars. Here is the proportion of skiers with knee injuries next to the proportion of snowboarders with knee injuries (0.16, from the clinic's 150 injured snowboarders), with a vertical axis that starts at 0.15 instead of 0:
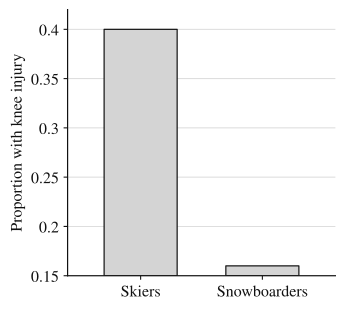
The skier bar looks about 25 times as tall as the snowboarder bar, because the visible parts are and . The real ratio is . Bar heights only compare honestly when bars start at 0. When an axis doesn't, base your claim on the values, not the look.
Comparing groups
To compare two or more groups on the same categorical variable, graph each group's relative frequencies. The clinic also treated 150 snowboarders: 24 knee, 54 wrist, 21 head, 27 shoulder and 24 other injuries. Frequency bars would put 250 skiers against 150 snowboarders, and almost every skier bar would be taller just because there were more skiers. Dividing by each group's own total puts both on the same scale, and a side-by-side bar chart shows each category's bars next to each other:
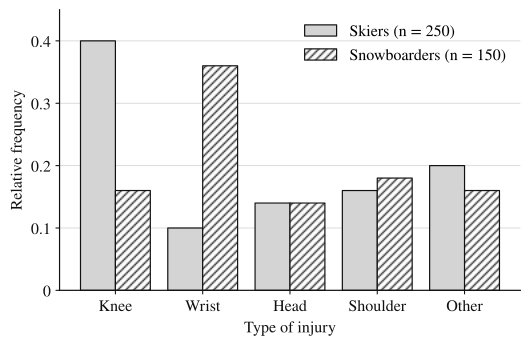
Two pie charts, one per group, also compare groups, since each pie is already in proportions. They make "what share of each group" easy to see but category-by-category differences harder; the side-by-side bar chart lines those up.
Worked examples
Of the 80 student-athletes at a high school, 28 play a fall sport as their main sport, 20 a winter sport and 32 a spring sport. Describe the bar chart of relative frequencies, and find the angle of each slice of a pie chart.
Show solution
Relative frequencies: fall , winter , spring . They add to 1, and each athlete has exactly one main sport, so a pie chart is appropriate.
Bar chart: seasons (Fall, Winter, Spring, in their natural order) on the horizontal axis; "Relative frequency" from 0 to about 0.45 on the vertical axis; three separated bars of heights 0.35, 0.25 and 0.40.
Pie angles: fall , winter (a quarter of the circle), spring . Check: .
A survey asked 200 teenagers which social media apps they use at least weekly and let them choose as many as applied. The results: 152 chose App A, 118 App B, 96 App C and 40 App D. A student plans to show the results in a pie chart. Explain why that is not appropriate, and name a graph that is.
Show solution
The counts add to , more than the 200 teenagers surveyed, because many teens use more than one app. A pie chart's slices must divide one whole, with each unit in exactly one slice; here the percentages (, , , ) add to , so there's no whole for them to divide.
A bar chart works: one bar per app, with height equal to the percentage of the 200 teenagers who use it weekly. Each bar stands on its own, so overlap between apps doesn't matter.
The side-by-side bar chart above shows the relative frequencies of injury types for the 250 skiers and 150 snowboarders treated at the resort's clinic last season.
(a) A clinic nurse says, "More skiers than snowboarders hurt their heads, so skiers are more likely to have head injuries." Do the data support this claim? Justify your answer.
(b) Compare the distributions of injury type for skiers and snowboarders.
(c) Explain why the side-by-side bar chart uses relative frequencies instead of frequencies.
Show solution
(a) No. More skiers than snowboarders had head injuries ( compared with ), but only because the clinic treated more skiers. Head injuries made up the same proportion, 0.14, of injuries in both groups, so the data give no evidence that head injuries are more likely among the injured skiers than among the injured snowboarders.
(b) The most common injury differs between the groups. Knee injuries were the most common for skiers (0.40 of injured skiers) but made up only 0.16 for snowboarders. Wrist injuries were the most common for snowboarders (0.36) and the least common for skiers (0.10). Head injuries (0.14 for both), shoulder injuries (0.16 for skiers, 0.18 for snowboarders) and other injuries (0.20 and 0.16) occurred in similar proportions in the two groups.
(c) The clinic treated 250 skiers and only 150 snowboarders. On a frequency scale, the skier bars would tend to be taller just because the group is larger. Relative frequencies divide each count by its own group's total, so the bars compare the share of each group with each type of injury.
Why these moves: (a) answers yes or no first, then gives the numbers that decide it, and names the reason the counts mislead. (b) points to the categories where the groups differ most, with values from the graph for each group, and says where they're alike. (c) names the group sizes, the concrete fact that makes counts unfair. All three are about these patients at this clinic, which is the context graders look for.
Where students lose points
Check yourself
Question 1
In a survey of 120 commuters, 45 said they usually take the train. In a pie chart of the survey's results, what is the angle of the train slice?
- A
- B
- C
- D
Show answer
C
The train category's relative frequency is , and the slice gets that fraction of : . Choice A uses the count as the angle; choice B uses the percentage, 37.5, as the angle.
- A
Question 2
For which of these data sets is a pie chart appropriate?
- A
The percentage of a town's households that own each of five kinds of pet, where a household can own several kinds
- B
The main language spoken at home by each of 300 students, with categories English, Spanish, Vietnamese, and Other
- C
The percentages of voters in three districts who voted yes on a measure
- D
The number of points a basketball team scored in each of its 20 games
Show answer
B
Each student has exactly one main home language and "Other" covers everyone left, so the slices make one whole. In A a household can be in several categories, so the percentages need not add to 100%; C has three separate groups' yes rates, not parts of one whole; D is a quantitative variable.
- A
Question 3
Two pie charts show how students in two classes get to school. In Class A, which has 30 students, the Walk slice is 40%. In Class B, which has 50 students, the Walk slice is 30%. Which class has more students who walk, and which has a larger share of walkers?
Show answer
Class B has more walkers (, compared with ), but Class A has the larger share of walkers (40% compared with 30%).
A pie chart shows proportions, so the size of a slice says nothing about counts until you multiply by the group's total. "More" and "a larger share" are different questions, and here they have different answers.
Question 4
A relative frequency bar chart shows the preferred candidate of 400 surveyed voters. The bar for Candidate Ruiz is at 0.35 and the bar for Candidate Okafor is at 0.28. How many more of the surveyed voters preferred Ruiz than Okafor?
Show answer
voters
Ruiz: voters. Okafor: voters. The difference is , the same as . Answering 0.07 gives a difference in proportions, not a number of voters.