Five numbers from Topic 1.7 (the minimum, , the median, and the maximum) cut a sorted data set into four pieces holding about a quarter of the values each. A boxplot draws those cuts on a number line, so you can see at a glance where the middle half of the data sits, which side is more stretched out, and which values are outliers.
The five-number summary and the boxplot
The five-number summary is the minimum, , the median, and the maximum, in that order. A boxplot (box-and-whisker plot) is its picture:
- A box runs from to , so it holds the middle 50% of the data, and its length is the IQR.
- A line inside the box marks the median.
- Whiskers run from the ends of the box outward. Without outliers, one goes from down to the minimum and the other from up to the maximum, so each whisker covers about 25% of the data.
- With outliers, each whisker stops at the most extreme value that is not an outlier, and every outlier is drawn as its own point (a dot or an asterisk). Outliers are found with the rule from Topic 1.7.
The four pieces (lower whisker, lower half of the box, upper half of the box, upper whisker) each hold about a quarter of the values, whatever their lengths. A long piece means those values are spread out, not that there are more of them. Pieces can also have zero length: if a quarter of the values all equal the minimum, then equals the minimum and the lower whisker disappears.
Building a boxplot with outliers takes four steps: find the five-number summary, compute the fences and , draw the box and median, then draw each whisker to the most extreme data value inside the fences and plot anything beyond them as a separate point. Always draw it on a number line with a scale and a label for the variable.
Reading shape from a boxplot
A boxplot shows skew through the lengths of its pieces. In a right-skewed distribution, the upper quarters are stretched: the median sits closer to than to , the right whisker is longer than the left, and any outliers are usually on the high side. A left-skewed distribution is the mirror image. In a roughly symmetric distribution, the median is near the middle of the box and the two whiskers are about the same length.
What a boxplot can't show is anything inside a quarter. Gaps, clusters and the number of peaks are invisible: a bimodal data set with a hole in the middle and a single-peaked data set can have exactly the same five-number summary and therefore the same boxplot. A boxplot also doesn't show how many values there are. When those features matter, use a histogram, dotplot or stemplot.
Where the mean falls: mean versus median
The median only cares about the middle position, but the mean is the balance point of every value (Topic 1.7). In a skewed distribution the long tail holds values far from the center on one side, and the mean slides toward them to stay balanced. The median doesn't move with them.
The word "usually" is real. With lumpy, discrete data (such as counts with only a few possible values), a distribution can be skewed one way while the mean and median sit the other way or are equal. So the mean-median comparison is evidence about shape, not proof. When a question gives you only a mean and a median, say the shape is "likely" skewed right or left, and give the reason: the mean is pulled toward the tail.
Worked examples
The ages, in years, of 20 cars in a parking lot are
1, 2, 2, 3, 3, 4, 4, 5, 5, 5, 6, 6, 7, 7, 8, 9, 10, 11, 13, 24.
The mean age is 6.75 years. Construct a boxplot of the car ages, and explain what the mean and median suggest about the shape.
Show solution
Five-number summary. With , the median is the mean of the 10th and 11th values: years. The lower half is the first 10 values, whose middle two are 3 and 4, so ; the upper half is the last 10, whose middle two are 8 and 9, so . The minimum is 1 and the maximum is 24.
Fences. years, and . The fences are and years. The 24-year-old car is above 16, so it is an outlier. Nothing is below .
Draw. The box runs from 3.5 to 8.5 with a line at 5.5. The left whisker goes to the minimum, 1. The right whisker stops at 13, the largest age that is not an outlier, and 24 is plotted as a separate point.
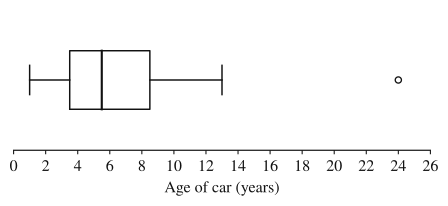
Shape. The mean (6.75 years) is greater than the median (5.5 years), and the boxplot agrees: the upper half of the box (5.5 to 8.5) is longer than the lower half (3.5 to 5.5), the right whisker is longer than the left, and the outlier is on the high side. The distribution of car ages is skewed right. The 24-year-old car pulls the mean up but not the median.
The boxplot summarizes the one-way commute distances, in miles, of a company's 80 employees.
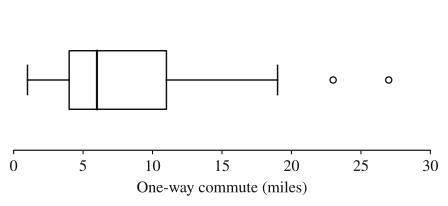
(a) About how many employees commute more than 11 miles? (b) Describe the shape, and predict whether the mean commute is greater or less than 6 miles.
Show solution
(a) 11 miles is , and about 25% of the values are above . So about employees commute more than 11 miles. (Ties at exactly 11 make this approximate, which is why the answer says "about".)
(b) The upper half of the box, from 6 to 11 miles, is miles long, while the lower half is miles. The right whisker covers miles, the left only miles, and both outliers (23 and 27 miles) are high. Each of these pieces holds about a quarter of the employees, so the upper quarters are spread over much more distance: the distribution of commute distances is skewed right. A right skew pulls the mean toward the long tail, so the mean commute is likely greater than the median of 6 miles.
A teacher reports these statistics for the final exam scores of 60 students:
The lowest score that is not an outlier is 41. (a) Is there an outlier at either end? Justify. (b) Construct a boxplot of the scores. (c) Explain how the mean and median are consistent with the shape of the distribution.
Show solution
(a) points and . The lower fence is and the upper fence is . The minimum score of 18 is below 34, so 18 is a low outlier. The maximum, 98, is below 114, so there are no high outliers.
(b) Draw a box from 64 to 84 with a line at 76. The left whisker runs from 64 down to 41, the lowest score inside the fence, and 18 is plotted as a separate point. The right whisker runs from 84 to 98.
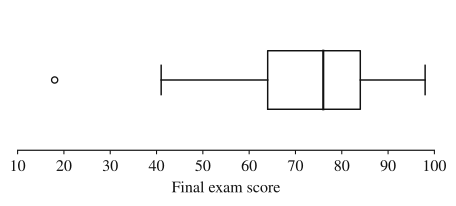
(c) The left whisker ( points) is longer than the right ( points), the lower half of the box () is longer than the upper half (), and the outlier is on the low side, so the distribution of scores is skewed left. In a left-skewed distribution the low scores in the long tail pull the mean down, so the mean (71.4) is less than the median (76), as the data show.
Where students lose points
On the exam
A boxplot question can ask you to construct one (show the fences when there's an outlier and label the axis with the variable and units), to estimate a count or percentage from the quartiles, or to judge shape from the pieces. When summary statistics are given without a graph, the exam can ask you to compare the mean with the median, or the distances from the median to each quartile, and name the likely skew.
Check yourself
Question 1
A boxplot of 200 values shows minimum 10, , median 30, and maximum 70, with no outliers. About how many of the values are between 25 and 70?
- A
50
- B
100
- C
150
- D
175
Show answer
C
From to the maximum covers three of the four quarters, about 75% of the data, and 0.75(200) = 150. Choice B counts only the box, from 25 to 45. Judging by the lengths of the pieces instead of their quarters leads to answers like D.
- A
Question 2
For a random sample of teenagers, the mean time spent on homework last night was 42 minutes and the median was 35 minutes. Which shape is most likely for the distribution of homework times?
- A
Skewed right
- B
Skewed left
- C
Approximately symmetric
- D
Approximately uniform
Show answer
A
The mean is well above the median, which is what happens when a long right tail of large values (a few students who worked for hours) pulls the mean up while the median stays with the middle of the data. Skewed left (B) would put the mean below the median.
- A
Question 3
Twelve values, sorted, are 3, 7, 8, 9, 10, 10, 11, 12, 13, 14, 15, 26. Where does each whisker of the boxplot end, and is any value plotted as an outlier?
Show answer
The median is 10.5, and , so IQR = 5 and the fences are 8.5 − 7.5 = 1 and 13.5 + 7.5 = 21. The value 26 is an outlier, plotted on its own. The upper whisker ends at 15, the largest value inside the fences, and the lower whisker ends at the minimum, 3, which is not an outlier.
A whisker runs to the most extreme value that is not an outlier. The 3 looks far from the rest, but it is inside the lower fence of 1, so the rule doesn't flag it.
Question 4
Which of the following cannot be determined from a boxplot alone?
- A
The median
- B
The interquartile range
- C
Whether the distribution has two peaks
- D
The range
Show answer
C
A boxplot shows only the five-number summary (and outliers). Two peaks, gaps or clusters inside any quarter of the data are invisible, so a bimodal data set can have the same boxplot as a single-peaked one. The median, IQR and range are all read straight off the plot.
- A