A bakery's sourdough loaves are supposed to weigh 900 grams, but no two come out the same: one is 893.4 g, the next 911.07 g. Weight can take any value in a range, so you can't list its possible values the way you listed the number of checked bags in Topic 2.9. What you can do is describe it with a smooth curve, and for many real measurements a normal curve is a close model.
Continuous random variables: probability is area
A continuous random variable can take any value in an interval: a weight, a time, a length. Its distribution is a density curve, a curve that never dips below the horizontal axis and has a total area of exactly 1 underneath it. The probability that the variable falls in an interval is the area under the curve over that interval.
Two consequences follow. The probability of any single exact value is 0, since a single point has no width and so no area; the chance a loaf weighs exactly 900.000... grams is 0. That's why, for a continuous variable, and are the same number. And every question about a continuous variable is a question about an interval: "between", "more than", "less than".
The same curve can be read two ways. As a model for data, it describes a population: the area between 870 and 915 is the proportion of all loaves with weights in that range. As a model for a random variable, it describes one random draw: the same area is the probability that a randomly selected loaf weighs between 870 and 915 grams. The numbers are identical; only the wording changes.
The normal curve and its two parameters
A normal distribution is continuous, unimodal, symmetric and bell-shaped. It is completely determined by two parameters: the mean , which sits at the center and peak, and the standard deviation , which sets the spread. It is written . The curve changes from bending downward to bending upward at exactly and , which is how you can spot on a sketch.
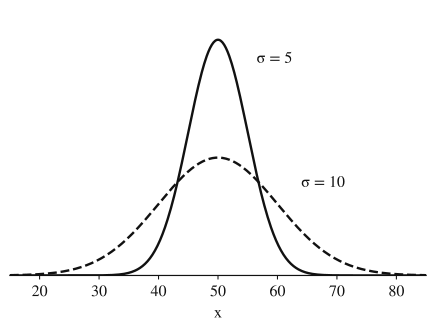
Because the total area must stay 1, spread and height trade off. A smaller squeezes the area close to the mean, so the curve has to be taller; a larger spreads it out, so the curve is lower and wider. The figure shows and : same center, and doubling halves the height of the peak.
Many variables are well modeled by a normal curve: heights of adults of one sex, weights of manufactured items, measurement errors, standardized test scores. A common reason is that the value is the result of many small, independent influences adding up. Plenty of variables are not normal, though. Incomes, house prices and waiting times are usually skewed right, and a normal model for them gives wrong answers. The normal curve is a model you choose because the data look like it, not a law every variable obeys.
The empirical rule
Every normal curve has the same proportions when you measure distance in standard deviations:
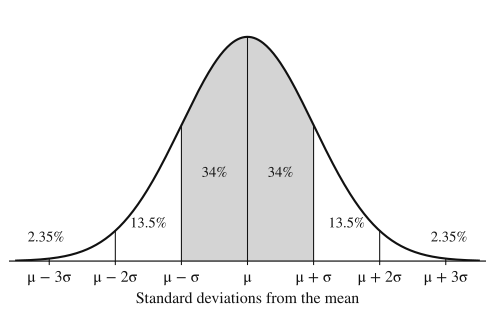
The rule is approximate. The exact area within 2 standard deviations is about 95.45%, and within 1 is about 68.27%. Use the rule when a question says to, or for quick estimates at whole numbers of standard deviations; use technology for anything else.
z-scores and the standard normal distribution
To handle a value that isn't a whole number of standard deviations from the mean, measure its distance in standard deviations exactly. The z-score of a value is
A loaf of 921 g from has : it is 1.4 standard deviations above the mean. Negative z-scores are below the mean.
If is , then its z-scores follow the standard normal distribution, : subtracting moves the center to 0, and dividing by rescales the spread to 1, while the shape stays normal. So one curve, and one table of its areas, answers every normal question. The table on the AP formula sheet gives the area to the left of . On a TI-84, normalcdf(lower, upper, , ) gives the area between two boundaries without standardizing (use or for an open end).
z-scores also compare relative positions. A value's percentile is the percent of the distribution below it, and in a normal distribution the percentile depends only on . Two values from different normal distributions with the same z-score sit at the same percentile of their own distributions.
From an area back to a boundary
Sometimes the area is given and the boundary is the question: the weight that only the lightest 5% of loaves fall below, or the limits that contain the middle 90%. Find the z-score with that area to its left (invNorm(area, , ) on a TI-84, or the table read in reverse), then convert back with . How you assign the area depends on the region:
- Lowest %: the boundary has to its left.
- Highest %: the boundary has , so its area to the left is .
- Middle %: , with the leftover area split evenly between the two tails.
- Most extreme % (both tails): the % is divided in half, so and .
The same equation, , also runs backward to find a parameter. If you know a percentile and one parameter, you know and , and you can solve for the other one; Example 4 does exactly this.
Worked examples
Weights of the bakery's sourdough loaves are approximately normal with mean 900 grams and standard deviation 15 grams. Use the empirical rule to answer each question.
(a) What percent of loaves weigh between 870 and 915 grams?
(b) What percent weigh more than 945 grams?
(c) Above what weight are the heaviest 16% of loaves?
Show solution
Start by marking the scale: , , , , , .
(a) 870 is 2 standard deviations below the mean and 915 is 1 above. The area from to is , and from to is 34%. Total: about 81.5% of loaves. (Technology gives 81.9%; the rule is an approximation.)
(b) 945 is 3 standard deviations above the mean. 99.7% lies within 3, so is outside, split evenly: about 0.15% weigh more than 945 g.
(c) Above lies of the area, so the heaviest 16% of loaves weigh more than 915 grams.
Times in a girls' 5-kilometer race are approximately normal with mean 24.0 minutes and standard deviation 2.0 minutes. Times in the boys' race are approximately normal with mean 20.5 minutes and standard deviation 1.5 minutes.
(a) What proportion of girls finished between 23 and 27 minutes?
(b) Priya finished in 21.5 minutes and her brother in 19.0 minutes. Who did better relative to their own race? Use percentiles.
Show solution
(a) Standardize both boundaries: and . The area between them under is , or with technology normalcdf(lower = 23, upper = 27, , ) . About 62.5% of girls finished between 23 and 27 minutes.
(b) Priya: . Her brother: . In a race, lower is better. The area to the right of is about 0.894, so Priya ran faster than about 89.4% of the girls. The area to the right of is about 0.841, so her brother ran faster than about 84.1% of the boys. Priya did better relative to her race: she is 1.25 standard deviations below her race's mean, farther than her brother's 1.00.
Her brother's raw time is faster, but a faster time in a faster field says less. The comparison has to be on a common scale, z-scores or percentiles, and the direction ("lower is better") has to be stated.
A factory makes bolts whose diameters are approximately normal with mean 10.00 mm and standard deviation 0.04 mm. Quality control rejects the most extreme 4% of bolts, too thick or too thin. Find the diameters that set the rejection limits.
Show solution
The 4% is split between the two tails: 2% below the lower limit and 2% above the upper limit. The lower limit has area 0.02 to its left, which is (invNorm(0.02, 0, 1)); by symmetry the upper limit is , which has area 0.98 to its left. Convert with :
Bolts thinner than about 9.918 mm or thicker than about 10.082 mm are rejected. Using , which leaves 4% in each tail, is the mistake to avoid: it rejects 8% in total.
A coffee machine fills 12-ounce cups. The amount it dispenses is approximately normal with standard deviation 0.4 ounce, and the owner can set the mean.
(a) With the mean set at 11.0 ounces, what proportion of cups overflow (receive more than 12 ounces)?
(b) The owner wants only 0.5% of cups to overflow. Keeping the standard deviation at 0.4 ounce, what should the mean be set to?
(c) Instead, the owner keeps the mean at 11.0 ounces and has the machine serviced to reduce the standard deviation. What standard deviation makes only 0.5% of cups overflow?
Show solution
(a) Let be the amount dispensed, . Then , and . About 0.62% of cups overflow.
(b) 0.5% overflow means 12 ounces is the boundary of the highest 0.5%, so it has area 0.995 to its left: . Solve :
(c) Now is fixed and is unknown, with the same : , so
Part (b) moves the whole curve left; part (c) narrows it.
Where students lose points
On the exam
Normal calculations show up in multiple choice and inside free-response questions, and a calculator is allowed on both sections of the exam, alongside the standard normal table on the formula sheet. Credit for a normal probability requires communication: name the distribution and its parameters, give the boundary and the direction (or a labeled sketch), and state the answer in context. When you work backward to a boundary or a parameter, show the z-score you used and the equation .
Check yourself
Question 1
Distribution A is normal with mean 70 and standard deviation 4. Distribution B is normal with mean 70 and standard deviation 8. Which statement is true?
- A
A's curve is taller and narrower than B's
- B
B's curve is taller because it has the larger standard deviation
- C
The two curves have the same height because they have the same mean
- D
B's curve has more total area under it than A's
Show answer
A
Both curves enclose a total area of 1. A's smaller standard deviation packs that area close to 70, so A must be taller and narrower; its peak is twice as high as B's. D is the tempting error: a wider curve looks bigger, but every density curve has area exactly 1.
- A
Question 2
Birth weights at a hospital are approximately normal with mean 3.4 kg and standard deviation 0.5 kg. Use the empirical rule to estimate the percent of babies born there who weigh less than 2.4 kg.
Show answer
About 2.5%.
, two standard deviations below the mean. About 95% of weights lie within 2 standard deviations, leaving 5% outside, split evenly between the tails: 2.5% below 2.4 kg.
Question 3
Heights of adult women in a country are approximately normal with mean 64.5 inches and standard deviation 2.5 inches. A clothing line is designed for the tallest 10% of women. What is the minimum height for the clothing line, to the nearest hundredth of an inch?
Show answer
About 67.70 inches.
The tallest 10% lie to the right of the boundary, so it has area 0.90 to its left: . Then inches. Using area 0.10 instead gives a height below the mean, the sign that the wrong tail was used.
Question 4
is normal with mean 50 and standard deviation 10. Which of the following has the same value as ?
- A
- B
- C
- D
0.68
Show answer
B
For a continuous variable, , so including or excluding the endpoint changes nothing: both equal about 0.841. A and C are the area on the other side of 60, about 0.159. D is the area within one standard deviation on both sides of the mean, not the area below .
- A