A cereal company says 20% of its boxes contain a prize. You buy 50 boxes and find prizes in only 4 of them, a proportion of 0.08. Is the company lying, or did you just get an unlucky set of boxes? You can't answer that from your 50 boxes alone. You need to know what proportions random samples of 50 boxes usually produce when the true rate really is 20%, and that is exactly what a sampling distribution tells you.
A statistic has its own distribution
Topic 2.9 separated a parameter (a fixed number describing a population or distribution, like the true prize rate ) from a statistic (a number computed from a sample, like the sample proportion ). A parameter has one value. A statistic changes from sample to sample, because each random sample contains different individuals. That variation isn't a flaw in the sampling; it's unavoidable, and it follows a predictable pattern.
The sampling distribution of a statistic is the distribution of its values over all possible samples of the same size from the same population. It answers the question "if I took every possible sample of this size, what values of the statistic would I get, and how often?"
Keep three distributions apart:
For a tiny population you can list every sample, and Example 1 does. For real populations the number of possible samples is astronomical (there are about ways to choose 20 people from a school of 200), so the sampling distribution is approximated by simulation or described by theory.
Simulating a sampling distribution
To simulate a sampling distribution, you assume a value for the parameter and let a computer play the role of the population:
- Set up a model of the population with the assumed parameter value (a prize rate of 0.20, say).
- Draw a random sample of size from the model and compute the statistic.
- Repeat step 2 a large number of times, recording the statistic each time.
- Graph the recorded values. Their distribution approximates the sampling distribution.
For the cereal claim, a computer drew 500 random samples of 50 boxes from a model where each box has a 0.20 chance of a prize, and recorded for each sample:
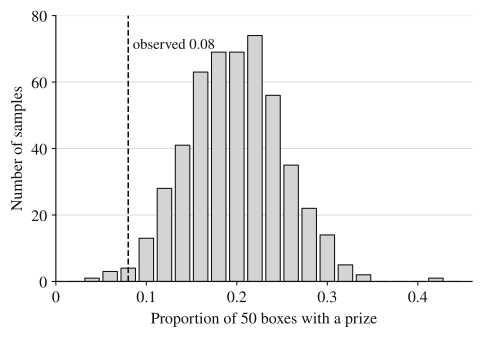
Describe it the way you'd describe any distribution (Topic 1.6): the simulated values are roughly symmetric and unimodal, centered at about 0.20 (the assumed parameter), and mostly between 0.10 and 0.30. Your result, 0.08, sits in the far left tail: only 8 of the 500 simulated samples, , gave a proportion of 0.08 or lower. If the true rate were 20%, a result this low would happen only about 2% of the time: the simulation estimates 1.6%, and the exact binomial probability (Topic 2.10) of 4 or fewer prize boxes in 50 is . That's convincing evidence that the true prize rate is less than 20%. Unit 3 turns this reasoning into formal hypothesis tests, and Topic 3.2 gives the sampling distribution of a formula.
Randomization distributions for experiments
Experiments need a slightly different simulation, because there's no population to resample. Suppose 10 volunteers are randomly assigned, 5 to chew caffeinated gum and 5 to chew a placebo gum, before a reaction test. Each volunteer's improvement in score is recorded:
The difference in means is points. But the random assignment itself creates differences: even if the gum did nothing, the 5 people who happened to land in one group might improve more. How big a difference does chance assignment alone produce?
Take the 10 improvements exactly as they are, shuffle them, deal 5 to "caffeine" and 5 to "placebo", and compute the difference in means. This reallocation imitates a world where each person's result would have been the same whichever gum they chewed, so any difference comes only from who ended up in which group. Repeat it many times. The distribution of the recorded differences is a randomization distribution, and it approximates the sampling distribution of the difference in means under that no-effect assumption.
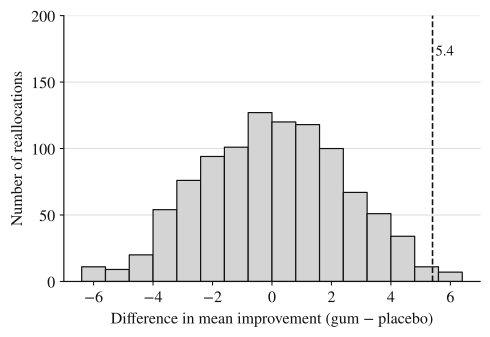
The reallocated differences center near 0, as they should when the gum makes no difference, and only 13 of 1,000 reached 5.4 or more. A difference as large as the one observed is rare from random assignment alone. The simulation puts it at about 1.3% of the time; listing all ways to split the 10 scores into two groups of 5 shows that exactly 4 of them give 5.4 or more, . Either way, the experiment gives convincing evidence that the caffeinated gum improved scores for these volunteers.
The central limit theorem
The shape of a sampling distribution depends on the statistic and the population. For the sample mean, one general result describes the shape for almost any population.
Why should averaging produce a bell curve? A sample mean averages independent values. An unusually large value in a sample is usually offset by ordinary ones, so the extremes of the population rarely survive into the mean, and the many small up-and-down contributions balance out. The figure shows it happening. The population is the time visitors spend on a web page, strongly skewed right with mean 4 minutes and standard deviation 4 minutes. The three histograms each show 10,000 simulated sample means.
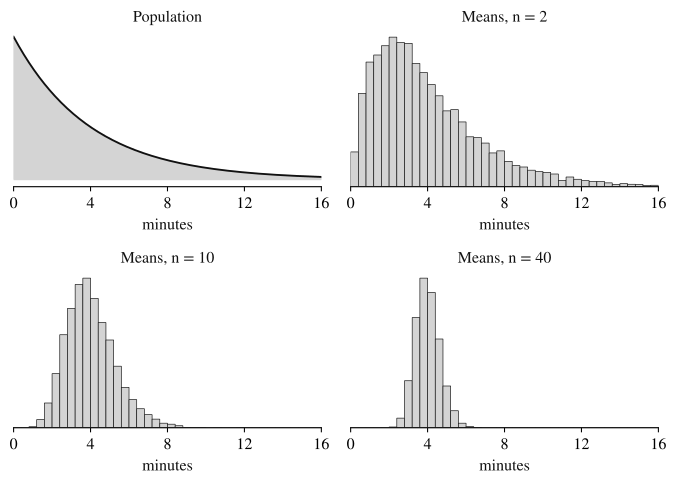
Two more things change as grows, and both are visible in the figure. The center stays at the population mean, about 4 minutes, for every . The spread shrinks: the simulated standard deviation of is about 2.90 minutes for , 1.27 for and 0.63 for . Topic 4.1 shows that the standard deviation of is , which here gives 2.83, 1.26 and 0.63 minutes; the simulated values differ from these only by chance variation. The CLT itself is a statement about shape, and only about sample means: it doesn't make the population normal, and it doesn't make the data in your sample normal.
Worked examples
Five employees have one-way commutes of 10, 14, 18, 22 and 36 minutes. Treat them as a population and take random samples of size 2 (without replacement). Find the sampling distribution of , and compare its center and spread with those of the population.
Show solution
There are possible samples. List each with its mean:
Each sample is equally likely, with probability . So in the sampling distribution each mean has probability , except 16, which two samples produce, so it has probability .
Center. The population mean is minutes. The mean of the 10 sample means is minutes, the same.
Spread. The population runs from 10 to 36 minutes, a range of 26. The sample means run from 12 to 29 minutes, a range of 17. Averaging pulls the extremes in: the 36-minute commute never appears alone; it is always averaged with a shorter one.
A manufacturer claims its batteries' lifetimes are approximately normal with mean 30 hours and standard deviation 2 hours. A store tests 8 randomly selected batteries, and the shortest one lasts 23.5 hours. To judge whether that is surprising, a computer simulated 200 samples of 8 lifetimes from the claimed distribution and recorded the minimum of each sample:
The two values below 24 were 22.9 and 23.8 hours. (Each class includes its left endpoint.)
(a) Describe the simulated sampling distribution of the sample minimum.
(b) Does the store's result give reason to doubt the manufacturer's claim? Explain.
Show solution
(a) The simulated minimums are skewed left, with a long tail toward short lifetimes and a peak in the 27-to-28-hour class. The center is between 27 and 28 hours: counting from the top, samples are 28 hours or more, and adding the 70 in the 27-to-28 class brings the total to 115, past the middle (the 100th and 101st values). The minimums range from 22.9 hours to somewhere between 30 and 31 hours.
Note that the center is well below 30 hours. The minimum of 8 lifetimes is, by definition, the smallest of them, so it almost always falls below the population mean. A sampling distribution is centered at the parameter only for statistics that are designed to estimate it, like for .
(b) Only 1 of the 200 simulated samples (the 22.9) had a minimum of 23.5 hours or less, a proportion of . If the claim were true, a shortest battery this short would happen in only about 0.5% of samples of 8. That gives reason to doubt the claim: the true mean may be lower than 30 hours, or the lifetimes more variable than the claimed standard deviation.
The amounts of individual purchases at a hardware store are strongly skewed right: most purchases are small, but a few (lumber, appliances) are very large. The mean purchase amount is $42.
(a) A manager randomly selects 100 purchases and makes a histogram of their 100 amounts. Describe the shape you would expect.
(b) The manager repeats the process 1,000 times, each time selecting a new random sample of 100 purchases and recording the sample mean . She makes a histogram of the 1,000 values of . Describe the shape, center and variability you would expect, and justify the shape.
(c) Would your answer to the shape in (b) change if each sample had only 3 purchases? Explain.
Show solution
(a) Skewed right. A histogram of one sample's data shows the distribution of a random sample of individual purchases, and a large random sample tends to look like the population it came from. The CLT doesn't apply: these are 100 individual amounts, not sample means.
(b) Approximately normal, by the central limit theorem: the sample size is large, so the sampling distribution of is approximately normal even though the population of purchase amounts is skewed right. Centered at about $42, the population mean. Much less variable than the individual purchase amounts in (a), because each averages 100 purchases and the occasional huge purchase is diluted by the small ones.
(c) Yes. With samples of only 3 purchases, the sampling distribution of would still be skewed right. A sample that happens to include one large purchase produces a large mean, and with nothing dilutes it. The CLT promises approximate normality only when is large, and a strongly skewed population needs a large .
The scoring point in (b) depends on the reason: "approximately normal because is large (CLT)". Saying "normal because the population is normal" is wrong here, and saying "normal" with no reason earns nothing.
Where students lose points
On the exam
Simulations show up as dotplots or histograms of simulated statistics, usually with the assumed parameter value stated. The questions ask you to describe the simulated distribution, locate an observed statistic in it, compute the proportion of simulated values as extreme as the observed one, and draw a conclusion in context. Central limit theorem questions ask for the shape of a distribution and the reason for it: say which distribution is approximately normal, name the sample size (or a normal population) as the reason, and keep the population, the sample and the sampling distribution separate.
Check yourself
Question 1
A high school has 1,200 students. Which of the following is a sampling distribution?
- A
The heights of all 1,200 students
- B
The heights of 40 randomly selected students
- C
The mean heights of every possible random sample of 40 students
- D
The mean height of all 1,200 students
Show answer
C
A sampling distribution is made of values of a statistic, one per sample, over all possible samples of a fixed size. A is the population distribution, B is the distribution of one sample, and D is a single number, a parameter. B is the tempting choice because it involves sampling, but it shows individual heights, not sample means.
- A
Question 2
The number of people per household in a large city is strongly skewed right. For which sample size would the sampling distribution of the sample mean household size be closest to normal?
- A
- B
- C
- D
All three would be equally skewed, because the population is skewed
Show answer
C
By the central limit theorem, the sampling distribution of gets closer to normal as the sample size grows, whatever the population's shape, so the largest wins. D confuses the population's shape, which stays skewed, with the shape of the distribution of sample means.
- A
Question 3
In an experiment, 12 plants were randomly assigned to a new fertilizer or the old one, and the new-fertilizer group grew 1.8 cm more on average. In 200 random reallocations of the 12 growth values to the two groups, 46 gave a difference of 1.8 cm or more. What does this suggest?
Show answer
Random assignment alone produced a difference this large in (23%) of reallocations, so a 1.8 cm difference is not unusual by chance. The experiment does not give convincing evidence that the new fertilizer increases growth.
The randomization distribution shows the differences that occur when the fertilizer makes no difference. A result matched or beaten 23% of the time by chance alone is easily explained by chance. That is not proof that the fertilizer has no effect, only a lack of convincing evidence that it does.
Question 4
The weights of a breed of dog are approximately normal. A veterinarian takes random samples of 4 dogs and records each sample's mean weight. What is the shape of the sampling distribution of the sample mean?
- A
Normal, because the population is normal
- B
Skewed, because the sample size is less than 30
- C
Unknown, because the central limit theorem needs at least 30 dogs per sample
- D
Uniform, because each sample of 4 dogs is equally likely
Show answer
A
When the population is normal, the sample mean is normal for every sample size, even . A large is needed only when the population is not normal. B and C apply the guideline where it isn't needed.
- A