The derivative is a limit as (topic 2.1), but measured data stops at the measurements. If a thermometer was read at 10 minutes and at 12 minutes, there is no reading at 10.001 minutes to put in the difference quotient. So when a function is known only through a table or a graph, you estimate its derivative with the smallest interval you actually have, and you say it is an estimate.
From a table: the difference quotient on the tightest interval
To estimate from a table, compute the average rate of change over the shortest interval in the table that contains :
- If falls between two table entries , use those two: .
- If is itself a table entry with entries on both sides, use the entries on either side of it.
- If is the first or last entry, the only choice is a one-sided quotient using its single neighbor.
The tightest interval is the best choice because a smaller puts the difference quotient closer to its limit. A wider interval measures the average behavior over a longer stretch, which can differ a lot from the behavior at .
Write the estimate with , show the quotient with the actual table values (that quotient is what earns credit), and give units: output units per input unit.
Why a centered quotient beats a one-sided one
When has table entries equally spaced on both sides, the centered (or symmetric) difference quotient
is usually far more accurate than a one-sided quotient with the same . A one-sided secant on a curving graph tilts too much in one direction; the centered secant spans both sides of , and the errors from the two sides largely cancel. In fact, the centered quotient is exactly the average of the left-side and right-side quotients.
Topic 2.1 showed that has . Compare two estimates using :
| Estimate | Value | Error |
|---|---|---|
| one-sided, | ||
| centered, |
The centered estimate is about 17 times closer. For a quadratic it is exact: for every .
From a graph: the slope of a tangent line
On a graph, is the slope of the tangent line at . If the tangent line is drawn, pick two points on the line itself (not on the curve), as far apart as the picture allows and preferably at grid intersections, and compute rise over run. If it isn't drawn, lay a straightedge along the curve so that it touches at and matches the curve's direction there, then read its slope the same way. The result is an estimate whose accuracy depends on the drawing.
Two shortcuts are exact. Where the graph is a straight segment, at any interior point of the segment is the segment's slope. Where the graph has a horizontal tangent (a smooth peak or valley), is .
With technology
A graphing calculator computes the value of a derivative at a point numerically. On the TI-84 this is the template (or the nDeriv command): you enter the function, the variable and the point. The calculator does not take a limit. It evaluates a centered difference quotient with a very small (the TI-84's default is ), which is accurate to many decimal places for the smooth functions on the exam.
Because it is only a difference quotient, the calculator returns a number even where the derivative does not exist:
- for at , the centered quotient is , though has a corner there and no derivative (topic 2.4);
- for at , it is , though the tangent line there is vertical and has no slope.
So a calculator value is trustworthy only where you already know the function is differentiable.
Worked examples
A cup of tea cools on a counter. Its temperature , in degrees Celsius, is measured at selected times , in minutes.
(a) Use the data in the table to estimate . Using correct units, interpret the estimate.
(b) Use the data to estimate .
Show solution
(a) The time lies between the entries and , so use that interval:
At time minutes, the temperature of the tea is decreasing at a rate of about 2.333 degrees Celsius per minute.
Using and instead would give , the average cooling rate over the whole 20 minutes, which says little about minute 7.
(b) The time is the last entry, so only a one-sided quotient is possible:
This interval is long and sits entirely before . The tea's cooling slows as it nears room temperature, so the true rate at is probably smaller in size than 1.375.
The graph of is shown below, together with the line tangent to it at (dashed).
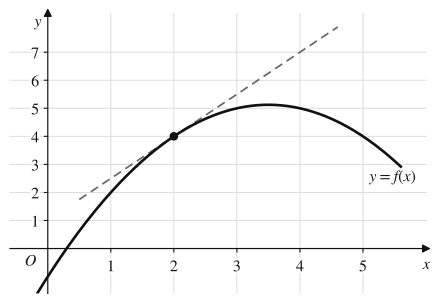
(a) Estimate .
(b) A student estimates with the average rate of change of over . What estimate does that give, and why is it poor here?
(c) Estimate the value of in at which .
Show solution
(a) The tangent line passes through and , both on grid intersections, so
(b) From the graph, , so the secant slope is . The graph bends downward between and , rising steeply at first and leveling off near , so the secant line over is much flatter than the tangent line at . An interval two units wide is too wide for a curve that bends this much.
(c) where the tangent line is horizontal, at the peak of the graph: .
The depth of water in a tidal channel is measured at selected times , in hours after midnight.
(a) Use the data in the table to estimate . Show the computations that lead to your answer. Using correct units, interpret your answer in the context of the problem.
(b) A model for the depth is feet. Find . Is the model's rate of change at consistent with your estimate from part (a)?
Show solution
(a) The time lies between and :
At 6 a.m. ( hours), the depth of the water is decreasing at a rate of about 0.55 foot per hour.
(b) With the calculator in radian mode, the numerical derivative of at gives
(the calculator shows ). The model has the depth falling at about 0.590 foot per hour at , close to the estimate of 0.55 foot per hour from the data, so the two are consistent.
On a calculator-active free-response part, the setup and the three-decimal answer are what is scored; you do not need to differentiate by hand. Store unrounded values if they feed later parts.
Where students lose points
On the exam
A derivative estimate from a table can be asked on either section. On no-calculator parts, an unsimplified quotient like is an acceptable answer. On calculator-active parts, a derivative value at a point is expected from the calculator rather than from hand work, reported correct to three decimal places.
Check yourself
Question 1
Values of a differentiable function are given in the table: , , , . Using the data, what is the best estimate of ?
- A
- B
- C
- D
Show answer
A
The shortest interval in the table containing is , so . Choice B uses and choice C uses , both much wider; choice D uses , which does not contain 3.5.
- A
Question 2
For , compute the centered difference quotient . How does it compare with , and why?
Show answer
It equals , exactly .
. For any quadratic the centered quotient is exact: , and .
Question 3
A calculator's numerical derivative of at returns . Which statement is correct?
- A
, so the graph of has a horizontal tangent at .
- B
does not exist; the calculator's centered quotient averaged the slopes and .
- C
is , and the calculator rounded it.
- D
is not continuous at , so the calculator's value is meaningless.
Show answer
B
The graph has a corner at , with slope on the left and on the right, so the derivative does not exist there. A centered difference quotient straddles the corner and gets . Choice D is wrong because is continuous at 2; the failure is the corner, not a break.
- A
Question 4
On a graph of , the line tangent at is drawn and passes through the points and . Estimate .
Show answer
The slope of the tangent line is . The two points are on the tangent line, not necessarily on the curve, which is exactly what you want for a tangent slope.