"The elevator speeds up, cruises, then slows to a stop" and a velocity graph shaped like a flat-topped hill describe the same ride. So do a row of dots spaced wider, then evenly, then closer, and a set of three equations, one per stage. Physics problems hand you one of these descriptions and ask questions that are easier to answer from another, so the skill is translating between them.
One motion, several representations
The same motion can be given as:
- a narrative: words, like the elevator sentence;
- a motion diagram: the object's position drawn as a dot at equal time intervals, with velocity arrows at the dots and an acceleration arrow;
- a figure of the physical setup;
- graphs of position, velocity or acceleration against time;
- equations such as or .
In a motion diagram, the spacing of the dots shows speed, because each gap is the distance covered in the same amount of time. Wider gaps mean faster motion. The velocity arrows lengthen or shorten with the speed, and the acceleration arrow points the way the velocity is changing.
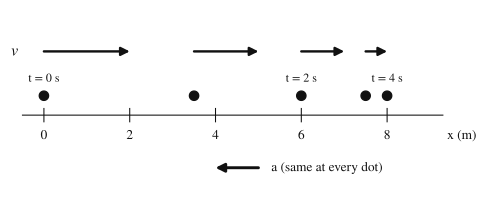
The cart in the diagram moves right and slows: the gaps shrink, so the speed drops, and the acceleration arrow points opposite the velocity arrows. Translated into the other forms, it starts at with a constant acceleration of , so , its velocity graph is a straight line falling from to zero at , and its position graph is a curve that rises less steeply each second and levels off at .
Slopes and areas connect the graphs
Topic 1.2 defined velocity as and acceleration as . On a graph, a derivative is the slope of the tangent line, and an integral is the area between the curve and the time axis. That gives four rules that let you build any one motion graph from another.
The area rules are just the integrals from topic 1.2. A thin strip of the - graph has height and width , so its area is the displacement during that sliver of time, and adding the strips adds the displacements. Units confirm it: .
Two features are worth reading straight off a graph. Where the - graph is curving upward (concave up), its slope is increasing, so ; where it curves downward, . And a point where the - graph crosses the time axis is a turnaround: the object has stopped and reversed, which on the - graph is a peak or a valley. A zero of the velocity graph does not mean the object is back where it started; only the area can tell you that.
Constant acceleration: three equations
When is constant, the integrals can be done once and for all. Integrate from to , starting from velocity :
Integrate that velocity, starting from position :
To get a relation without time, solve the first for and substitute into the second:
Each equation leaves out one quantity: the first has no , the second no (final), the third no . Pick the one that omits what you neither know nor need. The equations also carry the functional dependence that "predict the factor" questions test. From rest, , so tripling the time multiplies the distance by 9; and means that to stop from twice the speed at the same deceleration takes four times the distance.
If the acceleration changes partway (the elevator's three stages), apply the equations to each stage separately, using one stage's final position and velocity as the next stage's initial values. If the acceleration varies smoothly, as in topic 1.2's examples, these equations do not apply at all; integrate instead.
Free fall
Near Earth's surface, an object moving under gravity alone, with air resistance negligible, has a constant acceleration directed straight down, of magnitude . The measured value is about , and that is the value printed on the exam's table of information. The AP Physics C course description nonetheless sets as the value to use whenever a number is needed, and says that correct use of or is not penalized.
So free fall is a constant-acceleration problem with if you choose up as positive (or if you choose down as positive). It applies the whole time the object is in the air: going up, at the top, and coming down. At the highest point for an instant, but is still , because the velocity is changing from upward to downward. Mass does not appear anywhere in the equations, so in the absence of air resistance a heavy and a light ball dropped together land together. Topic 2.9 adds air resistance, which makes the acceleration depend on velocity.
Worked examples
A robot moves along a straight track, starting at . Its velocity is shown in the graph.
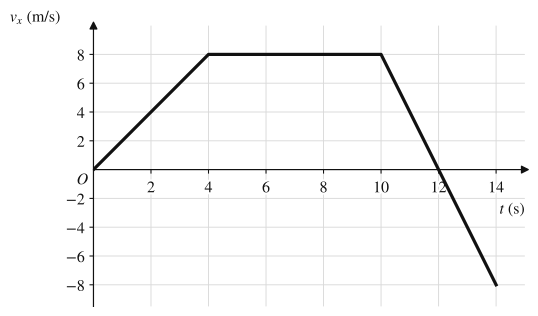
(a) Find the robot's acceleration during each segment. (b) Find its displacement and the distance it travels from to . (c) At what time is the robot farthest from its starting point, and how far is it? (d) Describe the shape of the - graph during each segment.
Show solution
(a) Each segment is straight, so its slope is a constant acceleration:
(b) Split the area where the graph crosses the axis, at :
| Interval (s) | Shape | Signed area (m) |
|---|---|---|
| 0 to 4 | triangle, | |
| 4 to 10 | rectangle, | |
| 10 to 12 | triangle, | |
| 12 to 14 | triangle, |
Displacement is the sum of signed areas, . Distance adds their sizes, .
(c) The robot moves in the direction while and turns back after , so it is farthest out at , at . The zero of the velocity graph, not the end of the graph, marks the farthest point.
(d) From 0 to 4 s, , so the - graph curves upward (a parabola getting steeper). From 4 to 10 s it is a straight line of slope . From 10 to 14 s, , so it curves downward, reaching a peak at where its slope is zero, then falling to at .
A stone is thrown straight up at from a bridge, starting above the river. Use and ignore air resistance. (a) How high above the river does it rise? (b) With what velocity does it hit the water? (c) How long is it in the air?
Show solution
Take up as positive and the launch point as , so and for the entire flight. The water is at .
(a) At the top . Time is neither known nor needed, so use the equation without it:
The top is above the river.
(b) Again no time needed, and the whole flight has one acceleration, so go straight from launch to water with :
The square root has two signs; the stone is moving down when it hits, so it is downward.
(c) Now use the velocity equation with the result of (b): , so . (Solving gives the same positive root; the negative root is a time before the throw.)
A driver traveling at speed sees a hazard. During a reaction time the car keeps its speed; then the brakes give a constant deceleration of magnitude until the car stops.
(a) Sketch the velocity-time graph of the stop. (b) Derive an expression for the total stopping distance in terms of , and . (c) Tests of one driver and car give from and from . Find and . (d) Doubling the speed did not double or quadruple the stopping distance. Use your expression to explain why.
Show solution
(a) A horizontal line at from to , then a straight line sloping down to zero, reaching it at . The flat part is the reaction; the slope of the second part is .
(b) is the area under that graph: a rectangle plus a triangle.
The braking term also follows from with , a useful check.
(c) Substitute both trials:
Doubling the first gives . Subtracting it from the second: , so . Then , so .
(d) The reaction distance is proportional to and the braking distance to . At they are and ; at , (doubled) and (quadrupled). The total, , is times : between 2 and 4 because it is a mix of a linear and a quadratic term. At higher speeds the quadratic term dominates and the factor approaches 4.
Where students lose points
On the exam
Expect to translate: build a velocity or acceleration graph from a position graph or a narrative, sketch an - graph whose slopes match a given - graph, or read a displacement as an area. A sketch earns credit for the right features: correct sign, straight versus curved, concave up versus down, and turning points at the right times, with axes labeled. Use unless the question gives another value. When you use a kinematic equation, say that the acceleration is constant (or why the equation applies) and write the equation before substituting.
Check yourself
Question 1
Over an interval, an object's position-time graph lies above the time axis, has a positive slope, and curves downward (concave down). Which describes the object during that interval?
- A
Moving in the direction and speeding up
- B
Moving in the direction and slowing down
- C
Moving in the direction and slowing down
- D
At rest, because the curve is flattening
Show answer
B
A positive slope means , so it moves in the direction. Concave down means the slope is decreasing, so , opposite the velocity, and the speed is dropping. Choice A reads the graph's height or rise as speed; only the slope gives velocity, and the slope is shrinking.
- A
Question 2
A cart moving at at has a constant acceleration , shown as a horizontal line on its - graph from to . What is its velocity at ?
Show answer
(moving in the direction at ).
The area under the - graph is the change in velocity: . Add it to the starting value: . The area gives , not itself, so the initial velocity is needed.
Question 3
A stone dropped from rest falls a distance during its first . Ignoring air resistance, how far has it fallen at the end of ?
- A
- B
- C
- D
Show answer
C
From rest with constant acceleration, distance fallen is , proportional to . Tripling the time multiplies the distance by . Choice B, , is the distance covered during the third second alone (); choice A assumes constant speed.
- A
Question 4
A cart's velocity-time graph is a straight line from at to at . Find its displacement and the distance it travels in those .
Show answer
Displacement ; distance .
The line crosses zero at . The triangle above the axis has area and the one below has . Signed areas sum to zero, so the cart ends where it started; the distance adds their sizes, .